Article Text

Abstract
Objective To systematically review the association between hip adduction and abduction strength, and adduction-to-abduction strength ratio in healthy athletes with the occurrence of future groin pain and time-loss groin injuries.
Design Systematic review with meta-analysis.
Data sources PubMed, Web of Science, SPORTDiscus, PEDro, Embase, and Scopus.
Eligibility criteria Studies included had to (1) measure hip adductor or abductor strength in healthy athletes, (2) conduct a follow-up period to assess the occurrence of groin pain, (3) present strength data separately for participants who remained uninjured and those who suffered an injury and (4) use a prospective design. Risk of bias was assessed according to the Quality in Prognosis Studies tool. The certainty in the evidence appraised was measured using the Grading of Recommendations Assessment Development and Evaluation approach.
Results Thirteen prospective cohort studies met the inclusion criteria. Overall study risk of bias was rated as low. Players who remained uninjured had stronger adduction strength compared with players who subsequently suffered groin pain (standardised mean differences with 95% CIs (SMD=−0.5, 95% CI −0.92 to −0.09)) and time-loss groin pain (SMD=−0.68, 95% CI −1.31 to −0.06). Trivial effects were observed for abduction strength (groin pain SMD=0.03, 95% CI −0.11 to 0.17; time-loss SMD=−0.07, 95% CI −0.25 to 0.11) and adduction-to-abduction strength ratio (groin pain SMD=−0.02, 95% CI −0.55 to 0.51; time-loss SMD=−0.11, 95% CI −1.11 to 0.89). Age and diagnostic criteria were not significant moderators of the relationship between adductor strength and groin pain (p=0.72 and p=0.12).
Conclusion There is a moderate effect of hip adductor strength on the occurrence of groin pain, while there is no relationship between either abductor strength or the ratio of adductor-to-abductor strength with the occurrence of groin pain.
PROSPERO registration number CRD42024548630.
- Strength
- Groin
Data availability statement
Data are available upon reasonable request.
Statistics from Altmetric.com
WHAT IS ALREADY KNOWN ON THIS TOPIC
Groin problems are among the most common injuries in multidirectional sports.
Hip strength plays a vital role in the prevention and rehabilitation of groin pain.
WHAT THIS STUDY ADDS
Hip adductor weakness is a potential risk factor for groin pain.
Neither abductor strength nor the adductor-to-abductor strength ratio was significantly related to the occurrence of subsequent groin pain.
HOW THIS STUDY MIGHT AFFECT RESEARCH, PRACTICE OR POLICY
These fingings suggest that athlete screening should incorporate adduction strength testing to identify individuals with lower strength values and implement injury prevention strategies.
Introduction
Groin pain is a complex problem due to its high occurrence in sports that involve rapid acceleration and deceleration, sprinting and sudden changes of direction, such as soccer,1–5 Australian rules football,6 Gaelic football,7 rugby8 and hockey.9 10 The classification of groin problems has become more complex, as a new injury definition includes cases that affect performance without leading to activity cessation (ie, non-time-loss injuries).11 In fact, considering only groin injury time-loss cases underestimates the true injury prevalence by 70% to 90%.11 12 Although most groin injuries affect the hip adductor muscles,13 14 different clinical entities, such as hip flexor-related,15 inguinal-related16 or pubic-related conditions,17 can cause pain in the groin region, making athlete evaluation difficult.18 19 Injuries not only affect players’ health but can also contribute to a reduction in team performance.20 Therefore, promoting interventions that aim to reduce the risk of developing groin pain is of utmost importance in sporting environments.21–23
Following a specific framework can help to mitigate the risk of suffering sports-related injuries. The four-step approach requires the presentation of epidemiological data and the identification of injury risk factors and mechanisms underlying injuries, followed by the introduction and testing of prevention strategies.24 Research on risk factors for groin pain has increased in recent years, although the mechanisms predisposing athletes to such injuries remain elusive.25 Proposed factors are a previous injury, adductor and abductor muscle weakness, male sex and deconditioning during off-season periods.26–28 Among the mentioned, factors that can be modified such as hip strength have received the most attention. Indeed, the inclusion of adduction strengthening programmes has been shown to promote adductor strength and reduce the occurrence of groin problems.29 30 If hip strength is prospectively related with future groin pain, identifying healthy athletes at risk may permit the selective inclusion of corrective interventions to avoid the onset of groin pain.
No study to date has meta-analysed the relationship between hip adduction and abduction strength or adduction-to-abduction strength ratio and future groin problems. Thus, the aim of this study was to systematically review the association between adduction strength and the occurrence of future groin problems. A secondary aim was to assess this relationship for abduction strength, and for adductor-to-abductor strength ratio. Analyses were performed for all groin pain cases and for time-loss cases only.
Methods
This systematic review adheres to Preferred Reporting Items for Systematic Reviews and Meta-Analyses (PRISMA) guidelines, and it is registered in the International Prospective Register of Systematic Reviews.
Literature search
Studies were identified through a systematic search on six databases (PubMed, Web of Science, SPORTDiscus, PEDro, Embase and Scopus), from inception until May 2024. A secondary search was performed screening previous systematic reviews on risk factors for groin injuries,26 31 reference lists of the included articles were also searched for additional references. Details of the key terms used for database search are shown in online supplemental table S1. Obtained records were imported into Zotero (V.6.0.36) and duplicates were removed. Two reviewers (MQ-C and GV-R) independently screened the titles and abstracts and assessed the full text of all potentially eligible articles to evaluate their possible inclusion in the review. Disagreement between the two reviewers was solved by discussion. A third reviewer (HO) was involved if consensus was not achieved.
Supplemental material
Study selection
Studies were included when they met the following criteria: (1) measured hip adduction or abduction strength in healthy athletes that (2) were followed up to assess for the occurrence of groin pain, (3) presented strength data separately for participants who remained uninjured and for those who suffered an injury and (4) used a prospective design. Studies that referred to groin pain/injuries, hip and groin pain/injuries or adductor-related groin pain/injuries were included,26 irrespective of the injury definition (ie, time-loss, non-time-loss and all injuries) or onset (ie, acute or long-standing).32 Studies were required to include participants involved in competitive sports, with no restrictions on sex, age, competitive level or sporting discipline. Additionally, studies were required to be written in English and published in a peer-reviewed journal. Grey literature (ie, conference papers, abstracts, theses and unpublished reports) was not considered for inclusion. Any article that failed to meet one of the inclusion criteria was excluded.
Risk of bias assessment
Included studies were assessed using the Quality in Prognosis Studies (QUIPS) tool, per previous similar systematic reviews.33 34 This tool consists of six different items for evaluation of risk of bias (study participation, study attrition, prognostic factor measurement, outcome measurement, study confounding and statistical analysis and reporting), an individual study was considered to have a low risk of bias if five of the six domains were assessed as having a low risk of bias (defined as a score of ≥75% for individual criteria under each domain). Any study that was determined to have a high risk of bias in the outcome measurement domain was automatically assigned a high risk of bias.33 Study quality for the included articles was performed by two reviewers (GV-R and IC) with conflicts resolved by consensus. The visual representation of the risk of bias for individual studies was performed using the robvis tool.35 Funnel plots and Egger’s test were used to provide an estimation of small study bias for the main outcome measure (adduction strength, all injuries).
Certainty of evidence grading
The quality of the evidence (QoE) was graded using the Grading of Recommendations Assessment Development and Evaluation (GRADE) approach.36 Initially, it was assumed that the quality was high. Quality was downgraded to moderate, low or very low when one of the following factors was rated as serious, or very serious: risk of bias, inconsistency,37 indirectness, imprecision38 or publication bias. Criteria used for downgrading evidence are detailed in online supplemental table S2.
Supplemental material
Data extraction
Data were extracted independently by two reviewers (MQ-C and HO) using Microsoft Excel. Study characteristics extracted were participant information (age, sex, height, body mass, sports), injury-monitoring data (follow-up time, injury definition, injury collection procedure, n of injured and uninjured participants) and strength assessment (muscle tested, body position, units of measurement). Measures of sample size, mean value and variance (typically SD) related to the injured and uninjured groups were also extracted for quantitative synthesis. When a study presented strength data as mean (SE), it was transformed to SD by multiplying an SE by the square root of the sample size to avoid inflation of the effect size.39 Where required data were only presented graphically, rather than documented in-text, data were manually extracted using WebPlotDigitizer (V.4.8). The authors of the included manuscripts were contacted via email when the studies did not provide sufficient information on outcome measures. No follow-up email was needed since the required data were obtained after the first contact.
Data analysis
All data analyses were conducted using R (The R Foundation for Statistical Computing), with the ‘meta’ and ‘metafor’ packages.40 41 Three meta-analyses were performed: (1) studies that evaluated adduction strength; (2) studies that evaluated abduction strength; and (3) studies that evaluated the adduction-to-abduction strength ratio. Additionally, a main analysis of all injuries and a sub-analysis for time-loss injuries were performed. Standardised mean differences (SMD) with 95% CIs were calculated from the original’s data comparison (uninjured vs injured) in each study with the mean and SD. We derived a 95% prediction interval (PI) to describe the range of true effects expected in 95% of future studies on this field.42 The chosen effect size was Cohen’s d and was interpreted using the following benchmarks: trivial (<0.20), small (0.20–0.49), moderate (0.50–0.79) or large (≥0.80).43 Data were pooled using a random effects model with the inverse variance method. The variability between studies was estimated with the τ2 statistic. The statistic I2 was used to measure the percentage of total variation in the effect sizes due to heterogeneity. After running the initial analyses, a secondary analysis was performed to account for the potential influence of studies with a very large effect size (see section "Adduction strength"). Finally, meta-regression was performed to assess the impact of age and differences in diagnostic criteria as potential effect modifiers when a minimum of 10 studies were available.44
Protocol deviations
A deviation from the PROSPERO registered protocol regarding secondary analyses was made. We did not initially plan to perform an influence analysis, as very large effect sizes were not anticipated in the included studies. Additionally, the decision to perform a meta-regression was made post hoc after including studies with substantial age differences (12 to 27 years of age) and differences in diagnostic criteria (self-reported or clinical examination).
Equity, diversity and inclusion statement
The research team consists of one woman and three men from different disciplines with early, mid and late career researchers, although all from one country. All studies included were from high-income countries with no representation from middle-income or low-income countries. We intended to investigate the effects of sex on our findings but lacked sufficient power, as female athletes constituted 3% of the sample.
Results
Search strategy
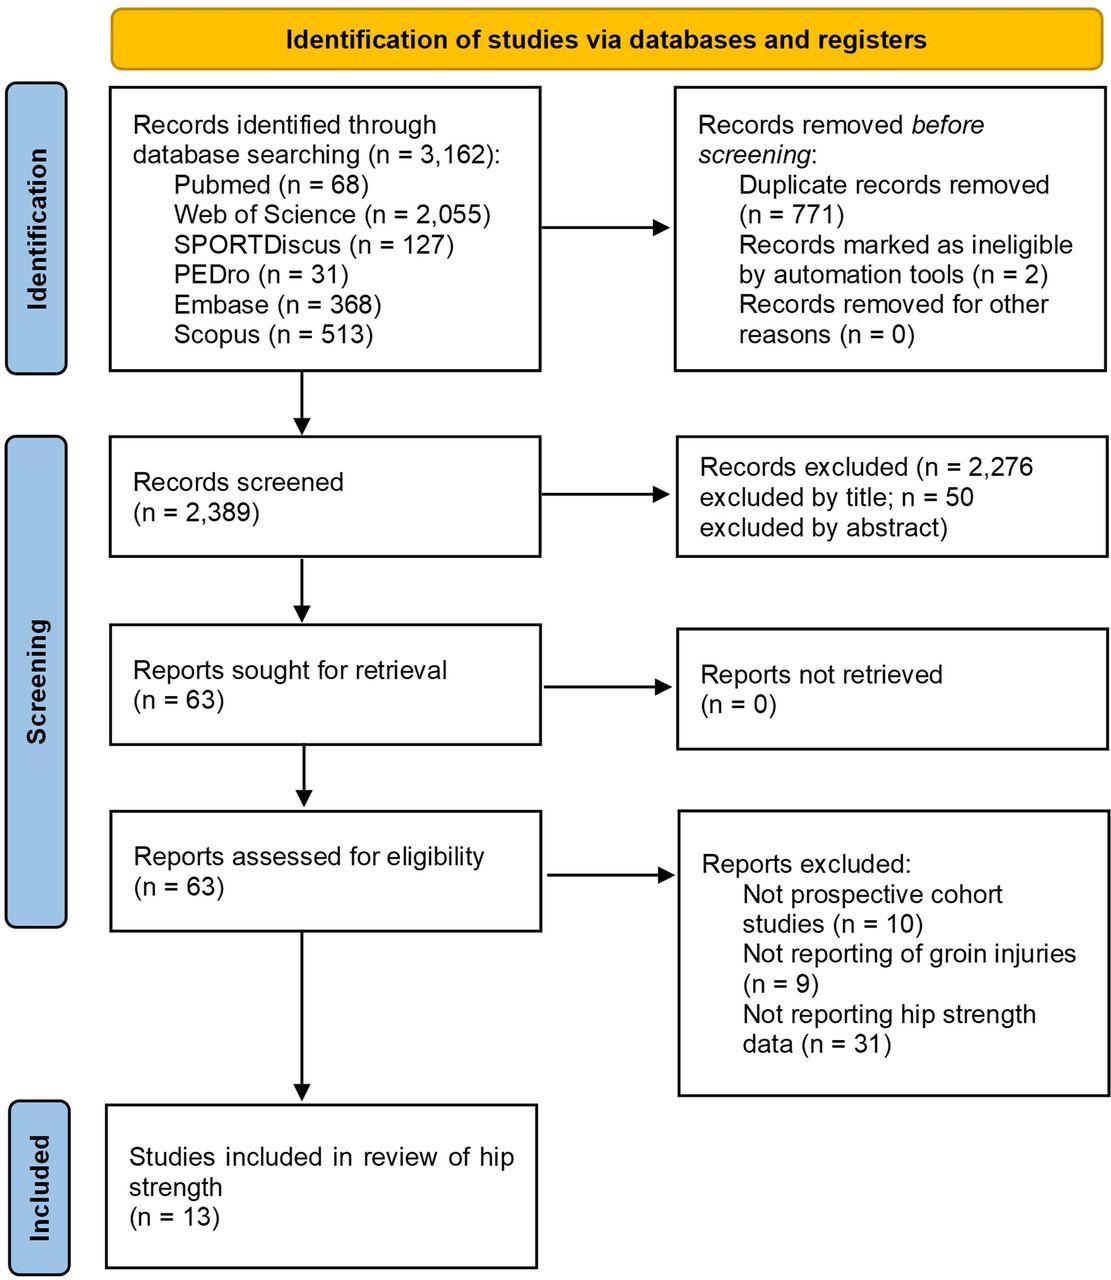
The electronic searches retrieved 3162 references from the literature. After removing duplicates and screening titles and abstracts, 63 full-text articles were obtained and assessed for inclusion. Thirteen prospective cohort studies met the eligibility criteria and were selected for qualitative and quantitative analysis.8 9 45–55 The search results are presented in figure 1.

PRISMA flow diagram. PRISMA, Preferred Reporting Items for Systematic Reviews and Meta-Analyses.
Risk of bias
Three of the included studies presented with a high risk of bias,47 51 53 with all others rated as of low risk. Individual scores in the QUIPS tool for all included studies are presented in figure 2. The use of Egger’s test and funnel plots demonstrated no evidence of small study bias (online supplemental figure S1).
Supplemental material

Study quality assessment results.
Description of studies
Participants
There were 1516 participants included in the meta-analysis, of which 478 suffered at least one episode of groin pain. Male players represented 97% (n=1469) of the entire sample. Eight studies investigated football players,45 46 48–50 53–55 three studies investigated ice hockey players,9 47 51 the two remaining studies investigated Gaelic football52 and rugby players8 (table 1).
Characteristics of the included studies
Testing protocol
Twelve studies conducted testing during preseason, while one study conducted testing during mid-season break.50 The most used tests were the adduction squeeze at 0°9 45–47 49 54 and 45° of hip flexion,46 48 52 54 55 two studies used the unilateral isometric with neutral hips47 53 and one with 25° and 50° of hip abduction,47 two studies used isokinetic testing8 50 while two studies used the side-lying eccentric break test.51 55 Seven studies presented abduction strength data.8 9 46 50 51 53 55 Data from maximal isometric testing were used over concentric or eccentric testing whenever possible, as most studies evaluated strength during isometric contractions. Additionally, results from long-lever tests were preferred over short-lever tests due to their superior test–retest precision.56 When different units of measurements were reported, relative values were preferred over absolute values (Nm/kg>N/kg>N). An overview of the methods used to measure adduction and abduction strength, along with the units of measurement, can be found in online supplemental tables S3–S5.
Supplemental material
Supplemental material
Supplemental material
Injury monitoring
Studies collected injury data during 4 weeks,47 14 weeks,49 one season9 45 46 52–54 or two seasons.48 51 55 Two studies did not specify the duration of injury collection.8 50 Groin problems were diagnosed by the team medical staff in nine studies,8 45 46 48 50–53 55 three studies collected self-reported data from the players,9 49 54 and one study did not specify the procedure of injury reporting.47 The specific diagnostic criteria and characteristics from each study are presented in table 2.
Groin pain diagnostic procedures
Meta-analyses
Adduction strength
Athletes that remained healthy displayed significantly stronger hip adduction strength compared with those that subsequently suffered any groin problem (SMD=−0.5, 95% CI −0.92 to −0.09, PI=−2.1 to 1.1, moderate effect). The analysis was repeated after excluding one article that obtained a very large effect size (SMD=−2.3),48 athletes who remained injury-free were also significantly stronger compared with injured participants (SMD=−0.32, 95% CI −0.61 to −0.03, PI=−1.31 to 0.67, small effect). For the analysis evaluating injuries that led to time-loss, a significant effect was found in favour of athletes that remained uninjured (SMD=−0.68, 95% CI −1.31 to −0.06, PI=−2.8 to 1.5, moderate effect). Influence analysis was repeated following the same principle, no significant difference was observed between injured and uninjured athletes (SMD=−0.44, 95% CI −0.9 to 0.02, PI=−1.93 to 1, small effect) (figure 3).

Standardised mean differences (SMD) of adductor strength compared between subsequently injured and uninjured athletes. Data are subgrouped by all injuries and time-loss injuries.
Abduction strength
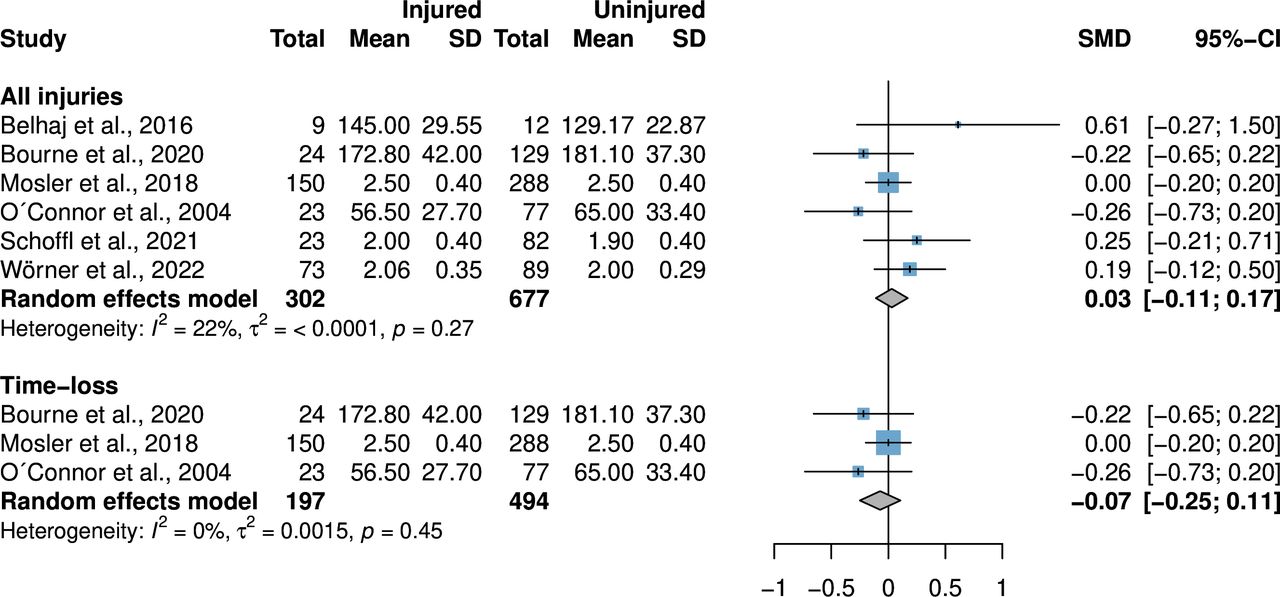
No significant differences were observed between injured and uninjured athletes for hip abduction strength, neither for all groin injuries (SMD=0.03, 95% CI −0.11 to 0.17, PI=−0.16 to 0.22, trivial effect) nor for time-loss injuries (SMD=−0.07, 95% CI −0.25 to 0.11, PI=−1.32 to 1.18, trivial effect) (figure 4).

Standardised mean differences (SMD) of abductor strength compared between subsequently injured and uninjured athletes. Data are subgrouped by all injuries and time-loss injuries.
Adduction-to-abduction strength ratio
No significant differences in adduction-to-abduction strength ratio were observed between players who subsequently suffered groin problems and players who did not sustain an injury (SMD=−0.02, 95% CI −0.55 to 0.51, PI=−6.16 to 6.12, trivial effect). Pooled effect sizes for time-loss injuries were also similar (SMD=−0.11, 95% CI −1.11 to 0.89, trivial effect) (figure 5).

Standardised mean differences (SMD) of adductor to abductor strength ratio compared between subsequently injured and uninjured athletes. Data are subgrouped by all injuries and time-loss injuries.
Meta-regression
Neither age nor diagnostic criteria were significant moderators of the relationship between adductor strength and injury in the main analysis for all injuries (p=0.72 and p=0.12). The results remained consistent after performing the influence analysis (p=0.64 and p=0.15). Visualisation of regression analysis for age is provided in figure 6. No meta-regression was performed for abduction strength and adduction-to-abduction strength ratio due to insufficient number of studies available.

Meta-regression analysis on the influence of age on adductor strength, comparing prospectively injured and uninjured athletes for: (A) all injuries and (B) influence analysis. The size of each bubble is proportional to the sample size of each study. The black line represents the regression line of best fit. Grey-shaded area represents the 95% CIs of the regression line. Horizontal dashed line represents no effect.
Certainty of evidence
The evidence profile according to the GRADE is presented in table 3. The resulting quality of evidence was low or very low in five out of six meta-analyses, high quality was achieved in the analysis of hip abduction strength for all groin injuries.
Summary of the certainty in the evidence appraised
Discussion
This is the first systematic review with meta-analysis that synthesises the available data pertaining hip adduction and abduction strength and the occurrence of future groin pain. A moderate effect size in adduction strength was observed between athletes who experienced subsequent groin pain and those that do not. The meta-analyses of abduction strength observed trivial effect sizes between athletes who subsequently injured and those who remained uninjured, with high certainty in the evidence appraised. Conversely, meta-analyses for adduction strength and adduction-to-abduction strength ratio obtained low to very low certainty in the evidence appraised. The meta-regression analysis found that neither age nor diagnostic criteria were significant moderators of the relationship between adductor strength and injury.
Influence of adductor strength on the occurrence of groin pain
Adductor strength seems relevant in the prevention of groin pain, various trials have found benefit in performing adductor strengthening exercises and reducing the risk of subsequent injury.30 57 Our meta-analyses observed a moderate effect of strength on subsequent appearance of groin pain, although the magnitude of the effect ranged from trivial to large. We decided to perform an influence analysis to account for a very large effect size presented in one of the included studies,48 the estimate was still significant although the effect shifted from moderate to small (SMD=−0.32). Although various factors interplay in the development of injuries, it is reasonable to assume that adduction strength is an important variable to take into consideration when aiming to prevent groin pain. Athlete screening should incorporate some sort of adduction strength testing to identify individuals with lower strength values and implement corrective intervention. Evaluation of athletes on a continuous basis compared against a single evaluation can detect players at higher risk, since there is a 6% to 10% decrease on force output the week before groin pain onset.49 58 Athletes with suboptimal strength levels may struggle to meet the demands placed on the adductor muscles, potentially leading to overuse damage and subsequent pain or injury. All the included studies evaluated peak strength but adductors may injure due to repetitive submaximal stimulus rather than on all-out efforts.59 Indeed, athletes who eventually develop groin pain tend to perform poorly on fatigue tests. De Queiroz et al 60 reported that players who later sustained injuries performed 14 fewer repetitions of the Brazilian Adductor Performance Test compared with their injury-free counterparts.
Although the included studies evaluated strength on a relatively neutral hip position (see online supplemental table S3), emerging evidence suggests that strength should be evaluated in an abducted position, since this is the kinematic position where athletes typically injure.47 61 Interest is growing around new testing methods, but without sufficient evidence, no strong claims can be made yet.
Influence of abductor strength and adductor-to-abductor strength ratio on subsequent injury
Six studies compared abduction strength between athletes who got injured and those who remained uninjured. The pooling of data found no significant difference between groups, with narrow 95% confidence and prediction intervals, and the same results were observed in the subanalysis for time-loss injuries. It has been hypothesised that stronger abductor muscles are a risk factor for suffering groin pain, by imposing higher demand on the adductors to brake the shank during side-to-side cutting, striding, quick acceleration/deceleration or sudden direction changes.27 62 This concept has also been associated with the force ratio, since athletes with an adduction-to-abduction strength ratio of less than 0.8 have been found to be 17 times more likely to incur a groin injury.51 Our meta-analyses on adduction-to-abduction strength ratio do not support this statement. The idea of a generic ratio where that athletes outside the normative values are at risk seems unlikely, as each sport generates specific adaptations on the athlete’s body. For instance, the adduction-to-abduction strength ratio has been reported to be 1.2 in football,63 1.1 in field hockey64 and 1.04 to 1.53 in ice hockey.47 Therefore, when attempting to associate a strength ratio with the prospective occurrence of injuries, we advocate for an approach that considers the specific context of each sport.
Effect of age on the estimates
Older age is one of the most studied determinants for developing injuries, primarily attributed to previous injuries and deconditioning, although there is contradicting information regarding its role in the context of groin pain.26 31 We conducted a meta-regression to evaluate the potential influence of age on our main outcome estimates. Age had no effect on either the overall estimate or the adjusted effect size following the influence analysis. Adult players are more prone to injury due to incomplete recovery from previous lesions and their increased years of experience, resulting in more playing time, which likely influences their odds of getting injured.65 On the contrary, adolescents could also be at risk due to rapid spikes in hip adduction strength during skeletal maturation.66 The passive tissues may not withstand with the force generated by the muscles, leading to potential failure and strain.67 68 Since groin pain rates are high in both young and adult athletes, we encourage practitioners to monitor adduction strength in all players regardless of their age.57
Limitations
This study is not without limitations. First, six studies used generic terms to refer to groin pain. Various clinical entities can generate symptoms in the groin region according to the Doha Agreement, and the risk factors for each entity may differ. Second, most groin pain cases included were adductor-related, which may explain the observed relationship between lower adductor strength and injury. However, this effect might be smaller for other clinical entities, although this hypothesis is yet to be confirmed. Third, 10 of the 13 studies measured hip strength using an isometric contraction, whereas groin injuries usually occur during eccentric actions. Evaluating hip eccentric strength could potentially reveal more pronounced differences between injured and uninjured athletes.69 This claim cannot be strongly supported with current data since there was insufficient information to analyse studies using eccentric strength exclusively. Fourth, the follow-up time varied across studies. It could be anticipated that injuries occurring closer to the assessment moment would have a stronger relationship with the examined factor, while an athlete sustaining an injury months after the assessment might not exhibit the same strength scores as at the time of evaluation. Current information is controversial since some studies have found benefit in performing various screening sessions throughout a season while others do not.70 71 Finally, generalising these results to women should be performed with caution since female participants represented 3% of the entire sample in our study. More studies are needed to assess the effect of strength on groin injury risk in female athletes.
Conclusion
There is a moderate effect of hip adductor strength on the prospective occurrence of groin pain with low-quality evidence. Robust findings confirm that there is no relationship between either abductor strength or the ratio of adductor-to-abductor strength and the occurrence of groin pain. Based on the available evidence, we recommend including adductor strength testing in athlete screening.
Data availability statement
Data are available upon reasonable request.
Ethics statements
Patient consent for publication
Acknowledgments
The authors would like to thank Frida Eek (PT) and Tobias Wörner (PT) (Department of Health Sciences, Lund University, Lund, Sweden) for providing us with the required data to include their study in the quantitative analysis.
References
Supplementary materials
Supplementary Data
This web only file has been produced by the BMJ Publishing Group from an electronic file supplied by the author(s) and has not been edited for content.
Footnotes
X @MQuintanaPT
Contributors MQ-C, HO designed the research question. IC performed the searches. MQ-C, GV-R, HO screened titles and full texts. GV-R and IC performed risk of bias assessment. MQ-C performed data analysis. MQ-C interpreted the findings and drafted the manuscript. All authors read and gave feedback on the final manuscript. HO is the guarantor of this work.
Funding The authors have not declared a specific grant for this research from any funding agency in the public, commercial or not-for-profit sectors.
Competing interests None declared.
Provenance and peer review Not commissioned; externally peer-reviewed.
Supplemental material This content has been supplied by the author(s). It has not been vetted by BMJ Publishing Group Limited (BMJ) and may not have been peer-reviewed. Any opinions or recommendations discussed are solely those of the author(s) and are not endorsed by BMJ. BMJ disclaims all liability and responsibility arising from any reliance placed on the content. Where the content includes any translated material, BMJ does not warrant the accuracy and reliability of the translations (including but not limited to local regulations, clinical guidelines, terminology, drug names and drug dosages), and is not responsible for any error and/or omissions arising from translation and adaptation or otherwise.